MITIGATION STRATEGIES FOR A MODERATE RADIATIVE TEMPERATURE OF THE LAND SURFACE – A CASE STUDY ON LOCAL SCALE URBAN HEAT ISLAND IN SUB URBAN REGION OF INDIA
Mira Shivani – Bharathidasan University
IEEE GeoScience and Remote Sensing Society
GeoHoziron 2022 conference
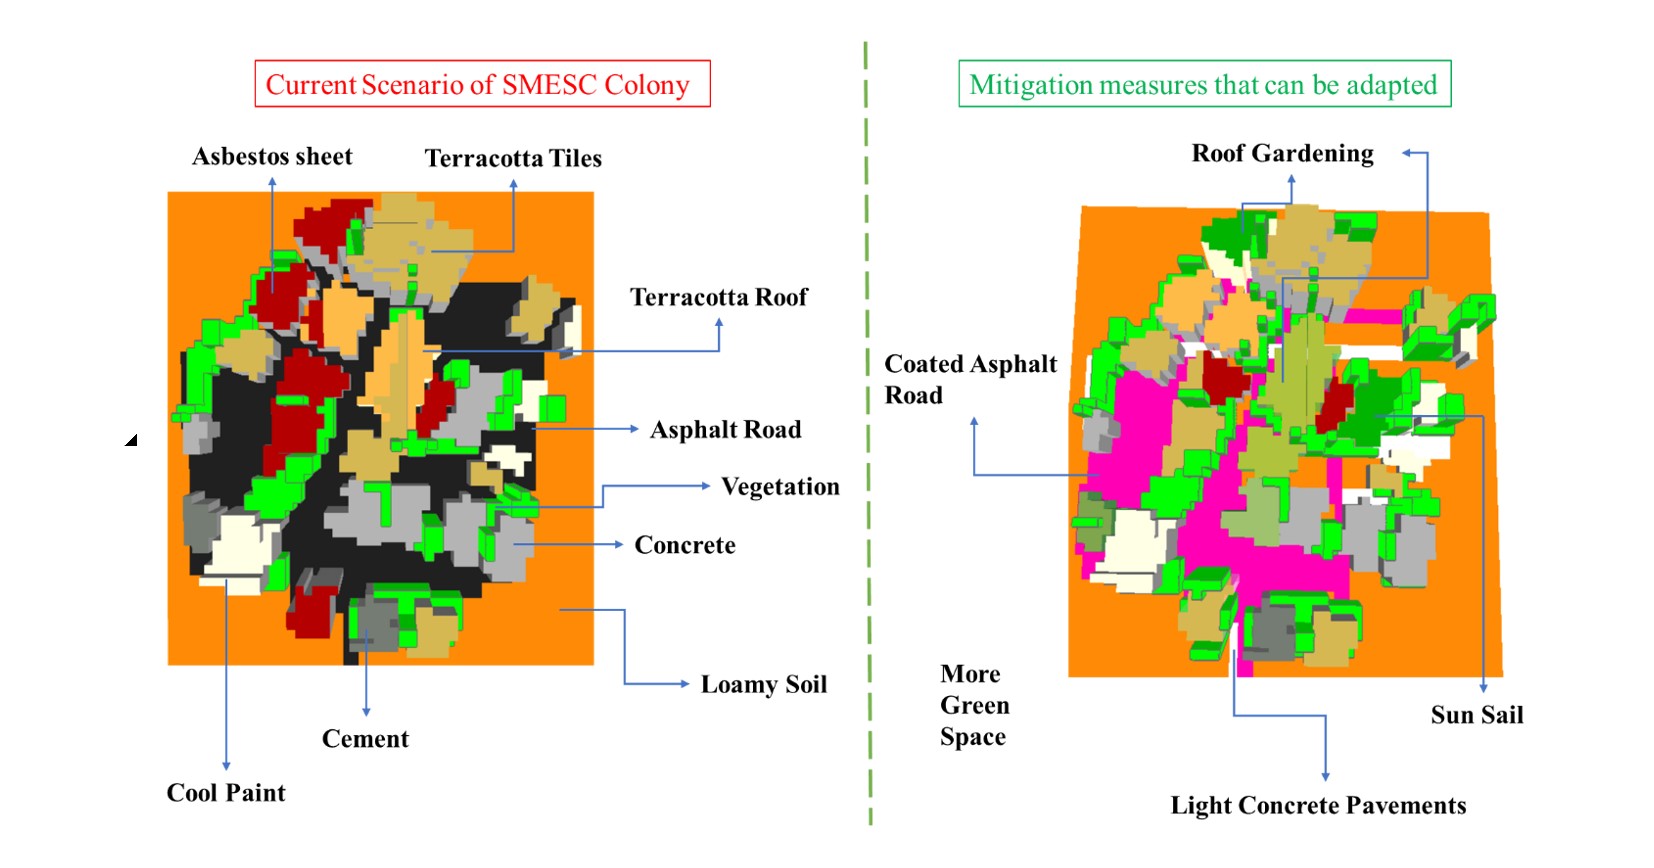
At present, the metropolitan cities are monotonously facing Urban Heat Island (UHI) effect all over the world. UHI effect is kind of heat accretion phenomenon that leads to so many problems in urban areas. The impact of UHI effect is even getting worse due to improper urbanization, inappropriate planning and designing of towns. Not only metropolitan cities are encountering high UHI effect, the developing suburbs are also expected to experience the destructive impact on health and well beings, so suburban area are also under the threat of global warming and UHI effect. The main purpose of this study is to evaluate the various divergent mitigation strategies using urban microclimate simulation model for a part of the surveyed region.
ArcGIS StoryMaps is a story authoring web-based application that allows to share the maps in the context of narrative text and other multimedia content. Story map was used for Mapping the spread of COVID-19. Since December 2019, the novel coronavirus pandemic has touched nearly every state of India, and upended the lives of hundreds of millions of people, according to official and unofficial statistics compiled by researchers. Spatial analytics was used to represent the count and scenrio.

MULTI CRITERIA EVALUATION FOR POTENTIAL FOREST ECOSYSTEM RESILIENCE
Mira Shivani – Bharathidasan University
FOS4G – ASIA (2021)
Climate change is evident and posing many challenges to the existing ecosystem across the globe. The rapid rate of urbanization, bursting out of the population, exhaustion of natural resources are few reasons for climate change. Effects of climate change are occurrences of various natural disasters, extinction of flora and fauna, heat waves, melting of glaciers, forest fires, exploited watersheds, floods, drought, etc. Ecosystems are deteriorated and becoming vulnerable as it is getting disturbed by various causes. One of the most important terrestrial ecosystems is forest, which is shrinking day by day as forest areas are getting converted to agrarian lands, then into plantations or settlements. Forests are the oxygen tanks and need to be preserved at any cause. Ecosystem resilience is a measure of the ability of a system to recover from a damaged state. The study is carried out in Valmiki national park, West Champaran, Bihar, India which is bordering Nepal and is connected with Chitwan national park. The study aims to evaluate the ecological resilience of the area in order to understand, maintain and restore the ecological conditions. With the help of remote sensing datasets and ecology datasets, the resilience index is calculated for the area by considering factors that influence the forest ecosystem such as soil, terrain, climate, and ecology. For determining the resilience index, the indicators are uniformly reclassified and weights are assigned to the parameters based on the priority. Discriminate factor analysis is a robust technique that has been developed to find out the resilience index in a simpler way. Based on the results, the area is classified into five classes namely, very low, low, moderate, high, and very high. With the geospatial analysis, it is evident that the area is low to moderately resilient in the national park with an average of 2.56. Thus, better management of the national park is required to increase the resilience of the forest ecosystem by reducing anthropogenic activities and promoting green innovation. This conceptual study is also applicable to global-level studies in the path of mitigating climate change.
SPATIO TEMPORAL SHORELINE PREDICTION AND VULNERABILITY ASSESSMENT ALONG THE PARTS OF COROMONDAL COAST, INDIA
Mira Shivani – Bharathidasan University
FOSS4G Korea (2020) and GeoHoziron 2022
Coastal Zone is a fragile & dynamic area where waves, tides and marine currents continuously modify the features in the coastal region. The study is carried out in Puducherry Coastal area, part of Coromandel coast, India which is stretched for approximately 20 Kms. The study aims to predict the shoreline changes and the vulnerable zones of Pondicherry coast. Temporal datasets are used for understanding the evolutional changes of the shoreline and predict the future changes along the coastline. SOI Toposheet (1972), Landsat-5 (1990) and Landsat-8 (2020) are acquired for the study. The shorelines were digitized and transect points were delineated for every 1 Km. The transect based differences were measured for all the three shorelines (either erosion or accretion ;1972-1990, 1990-2020). The study used Exploratory data analysis to recognize the data sets and condense their principal characteristics, to forecast the shoreline location in 2050. Also, the study assigned index values from 1-5 for Geomorphology, Coastal Slope, Rate of Erosion or Accretion, Rate of Sea level Rise, Mean Wave Height, Mean Tidal Range and then calculated the Coastal Vulnerability Index to classify into 5 classes as very low, low, moderate, high and very high which identifies the most vulnerable zone in the coastal region in the current scenario (2020).
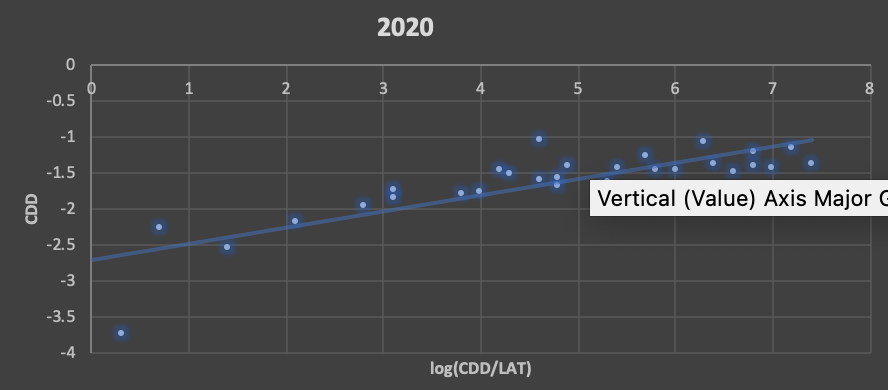
SPATIO TEMPORAL SHORELINE PREDICTION AND VULNERABILITY ASSESSMENT ALONG THE PARTS OF COROMONDAL COAST, INDIA
Aniruddha Khatua – National Institute of Technology Karnataka, Surathkal
FOSS4G Conference (2020)
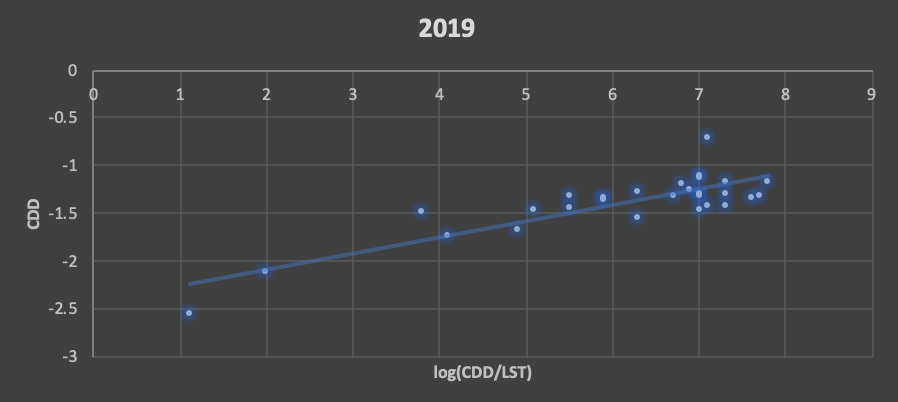
AIM: Study aims the effect of lockdown during COVID-19 on the spatio-temporal land surface temperature (LST) and Cooling Degree Days (CDD) patterns in Garmal village.
OUTCOME : Places with high built-up density had minimum decrease in LST; on the contrary, wards with large proportion of open spaces and having low, medium built-up density had the maximum decrease in LST, whereas the CDD is proportional. It was observed that there was an increase in number of hot spots accompanied by a decrease in thermal comfort level during lockdown.
REVIEW : The methodology proposed in the study can be applied to other Indian cities, which exhibit similar growth patterns and will provide a tool for rational decision-making.
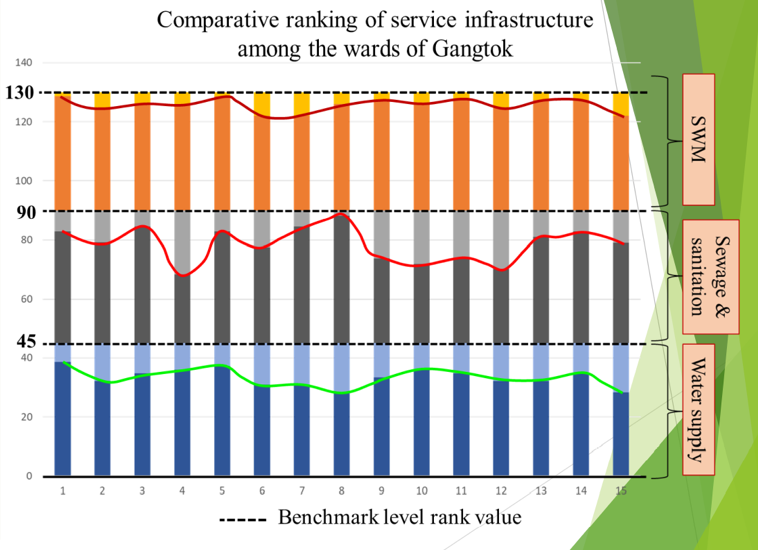
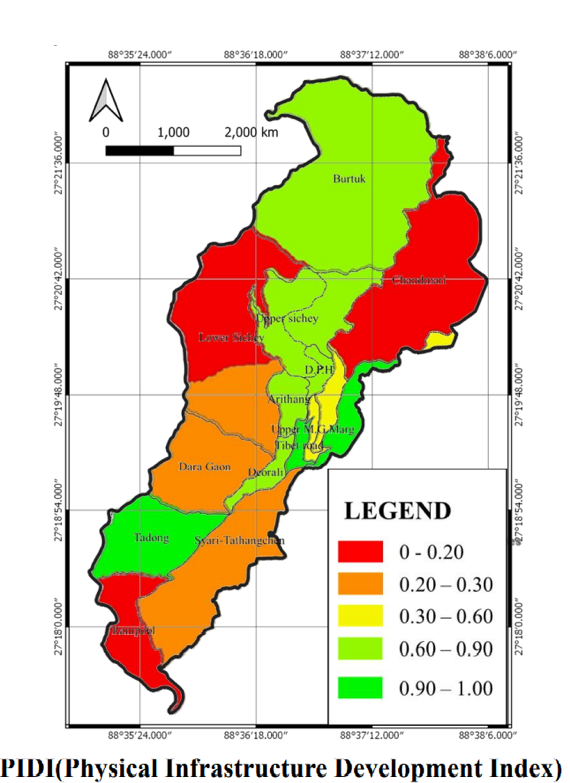
ASSESSMENT OF PHYSICAL INFRASTRUCTURE OF A HILL TOWN: A CASE STUDY OF GANGTOK, INDIA
Pousali Chakraborty - Visvesvaraya National Institute of Technology, Nagpur
FOSS4G Conference (2020)
AIM: Availability of infrastructural facilities (Physical and social) of Gangtok.
BACKGROUND: India is analysed based on the primary survey (2019) data collected at ward level through composite infrastructure development index (IDI). As one of the 12 pillars of global competitive index and recognized as goal 9 of Sustainable Development Goals (SDG 2030) by United Nations, infrastructure plays an important role in improving quality of life, economic growth and development
RESEARCH NEED & PLAN:Physical infrastructure helps improving the economic activity while social infrastructure helps building human capital. Various factors obtained based on user response are compacted further by a simple multivariate analysis to extract the most relevant and impactful ones to construct the index.
OUTCOME:The result shows an intra-ward non-uniformity, when ranked and mapped accordingly in QGIS to compare with the subsequent level of service. The result has a significant relationship with employment and poverty, thus can be considered as an important factor in determining the economic growth of the study area.
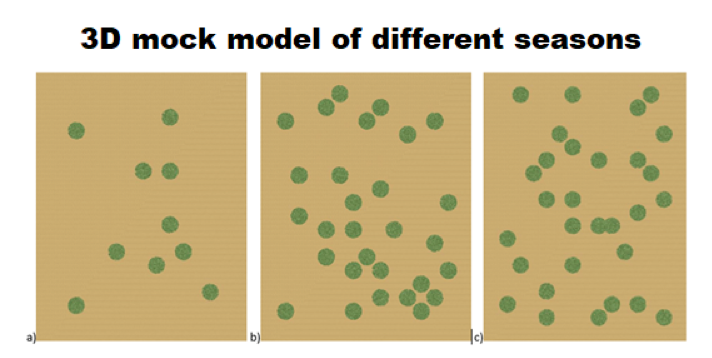
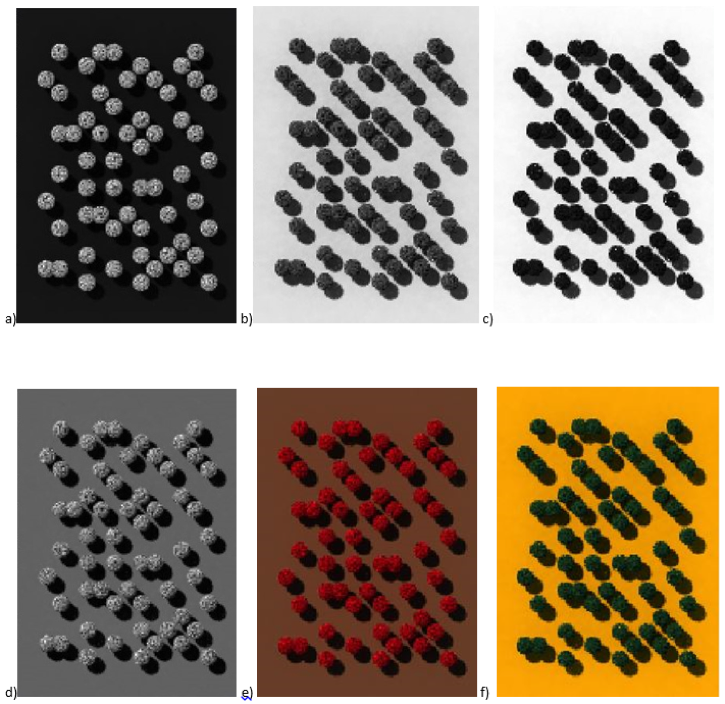
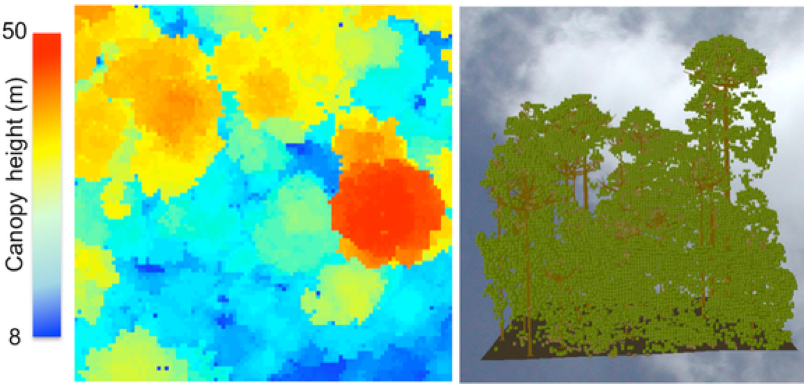
MODELING THE SPECIES OF ARAKU FOREST USING 3D DART MODEL
Muhammed Rashid R – National Institute of Technology Karnataka, Surathkal
FOSS4G Conference (2020)
AIM: Forest models are very much helpful as forest management tool as it gives information about the trees in the forest. The study is an attempt to construct a forest model using Discrete Anisotropic Radiative Transfer (DART) model.
DATA AND METHODS :70 trees of 10 different species are taken in three field visits conducted at three different seasons. The data like the type of species, position of trees (latitude and longitude), trunk height below the crown, trunk height within the crown, trunk diameter below the crown, crown height, leaf area index (LAI) and crown type are collected from Araku forest.
OBSERVATION : : Mainly two assumptions made for the construction of mock forest 1) The surface is Lambertian in nature, 2) Canopy structure of all collected trees are homogeneous. DART simulation editor window is used in software to give inputs. Flux tracking, a default radiative method is selected, and the Analytic method is selected as a method for transferring radiation between Top of Atmosphere (TOA) and Bottom of Atmosphere (BOA). Four spectral bands representing Blue, Green, Red, and near infrared (NIR) bands at mode R are given as Flux-tracking parameters. Aerial view and terrestrial views of mock forest were created along with images of different bands (red, green and blue) and composites (FCC and TCC). 3D DART model is a very useful method to construct mock forest if we have data about biophysical measurements and the location of trees in a plot.
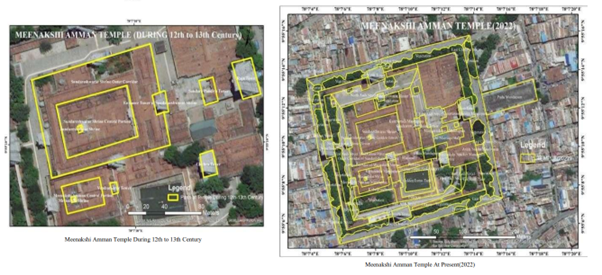
The "Spatial Turn" is an academic trend that emphasises the importance of studying place and space in the Humanities and Social Sciences. In this "Spatial Turn," researchers are particularly interested in looking into how the terrain has evolved. For one thing, the landscape acts as a bridge between the past and present, linking geographical locations with their respective eras. Studying a "Spatial Turn" necessitates looking at history, literature, and mapping all at once. Madurai City, in the state of Tamil Nadu, is home to several important Hindu and Buddhist sites, including the Meenakshi Amman Temple, the ThirumalaiNayakkar Palace, and the Rani Mangammal Palace. With the help of a technique called "Mapping with GIS," this article aims to investigate the "Spatial Turn" alongside the Landscape alteration study of these three distinct monuments. It is abundantly clear that the geo-cultural and geo-political actions that led to the demolition, destruction, and reconstruction of the buildings of those sites in the Madurai region were largely responsible for the "Spatial Turn" along those monuments